Mapping, Modeling and Monitoring

Navigating a Path Through the Energy Transition

To understand all the options, build a toolkit you can trust. KBC brings a trusted suite of world-class digital technologies to map interconnected processes and energy systems within battery limits and beyond. Dashboards synthesize the emissions information and distribute it to allow progress tracking at all levels. KBC is independent and therefore agnostic to specific technologies and product solutions. We act as partners and advocates for our clients – not vendors.

KBC energy management tools

Comprehensive Suite of Trusted Modeling Tools

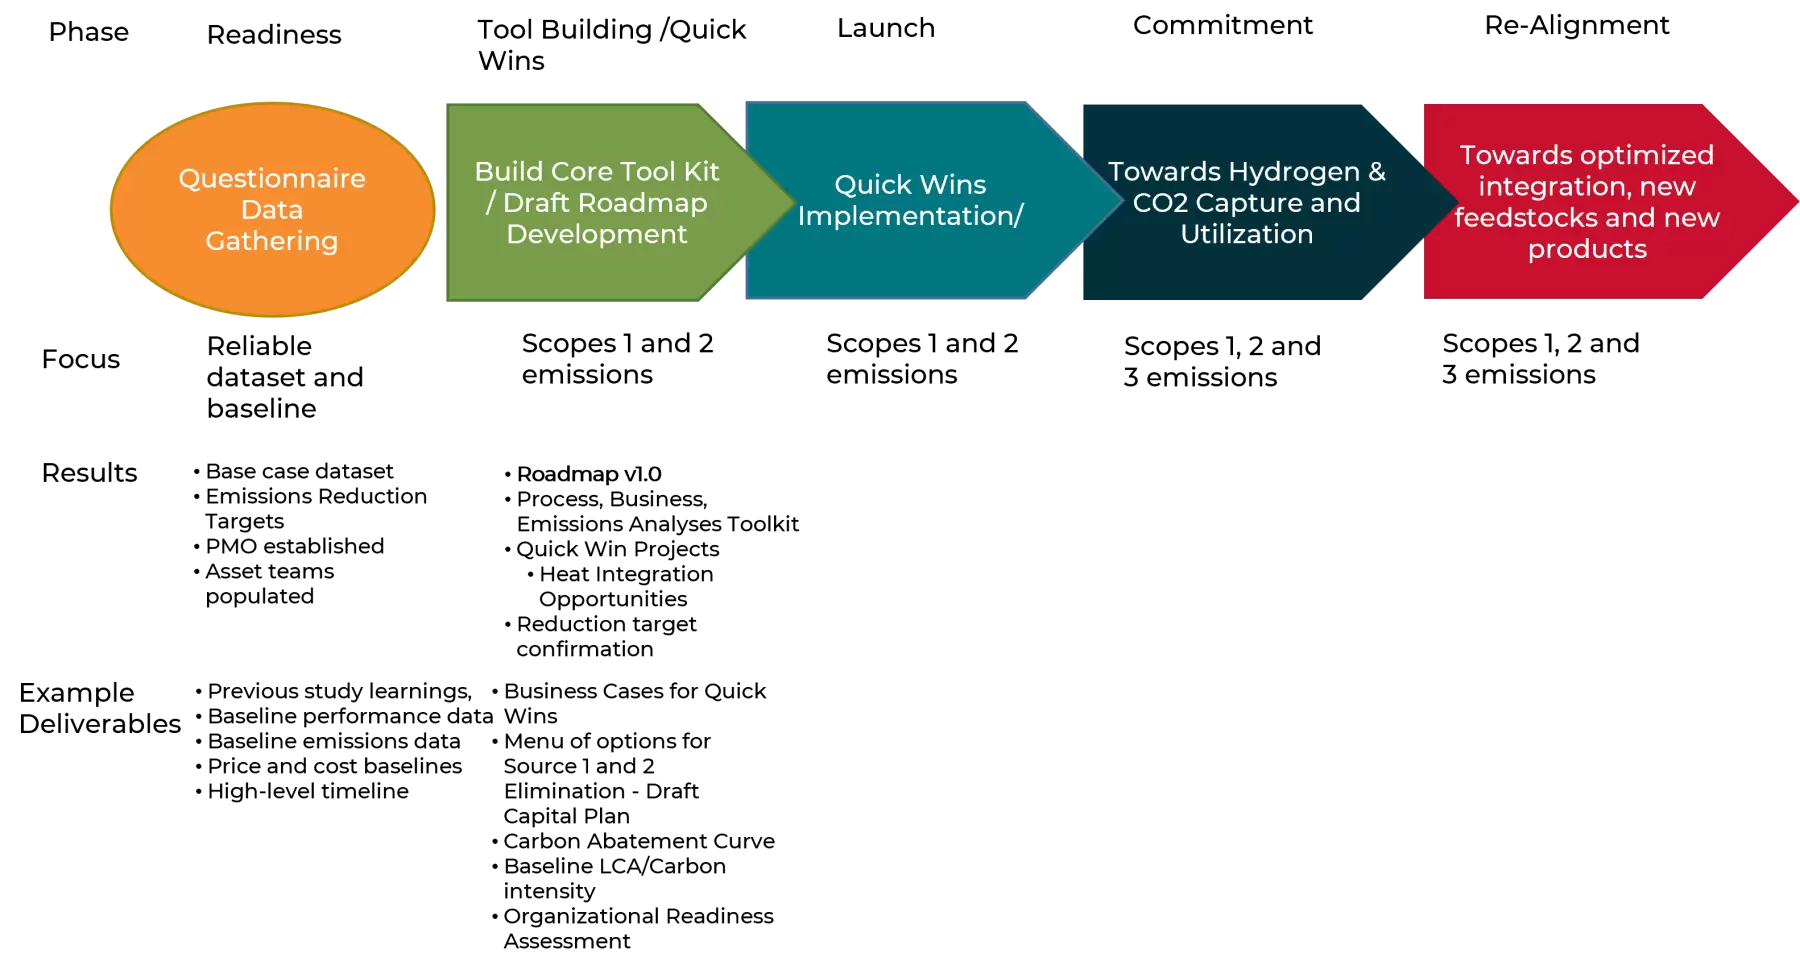
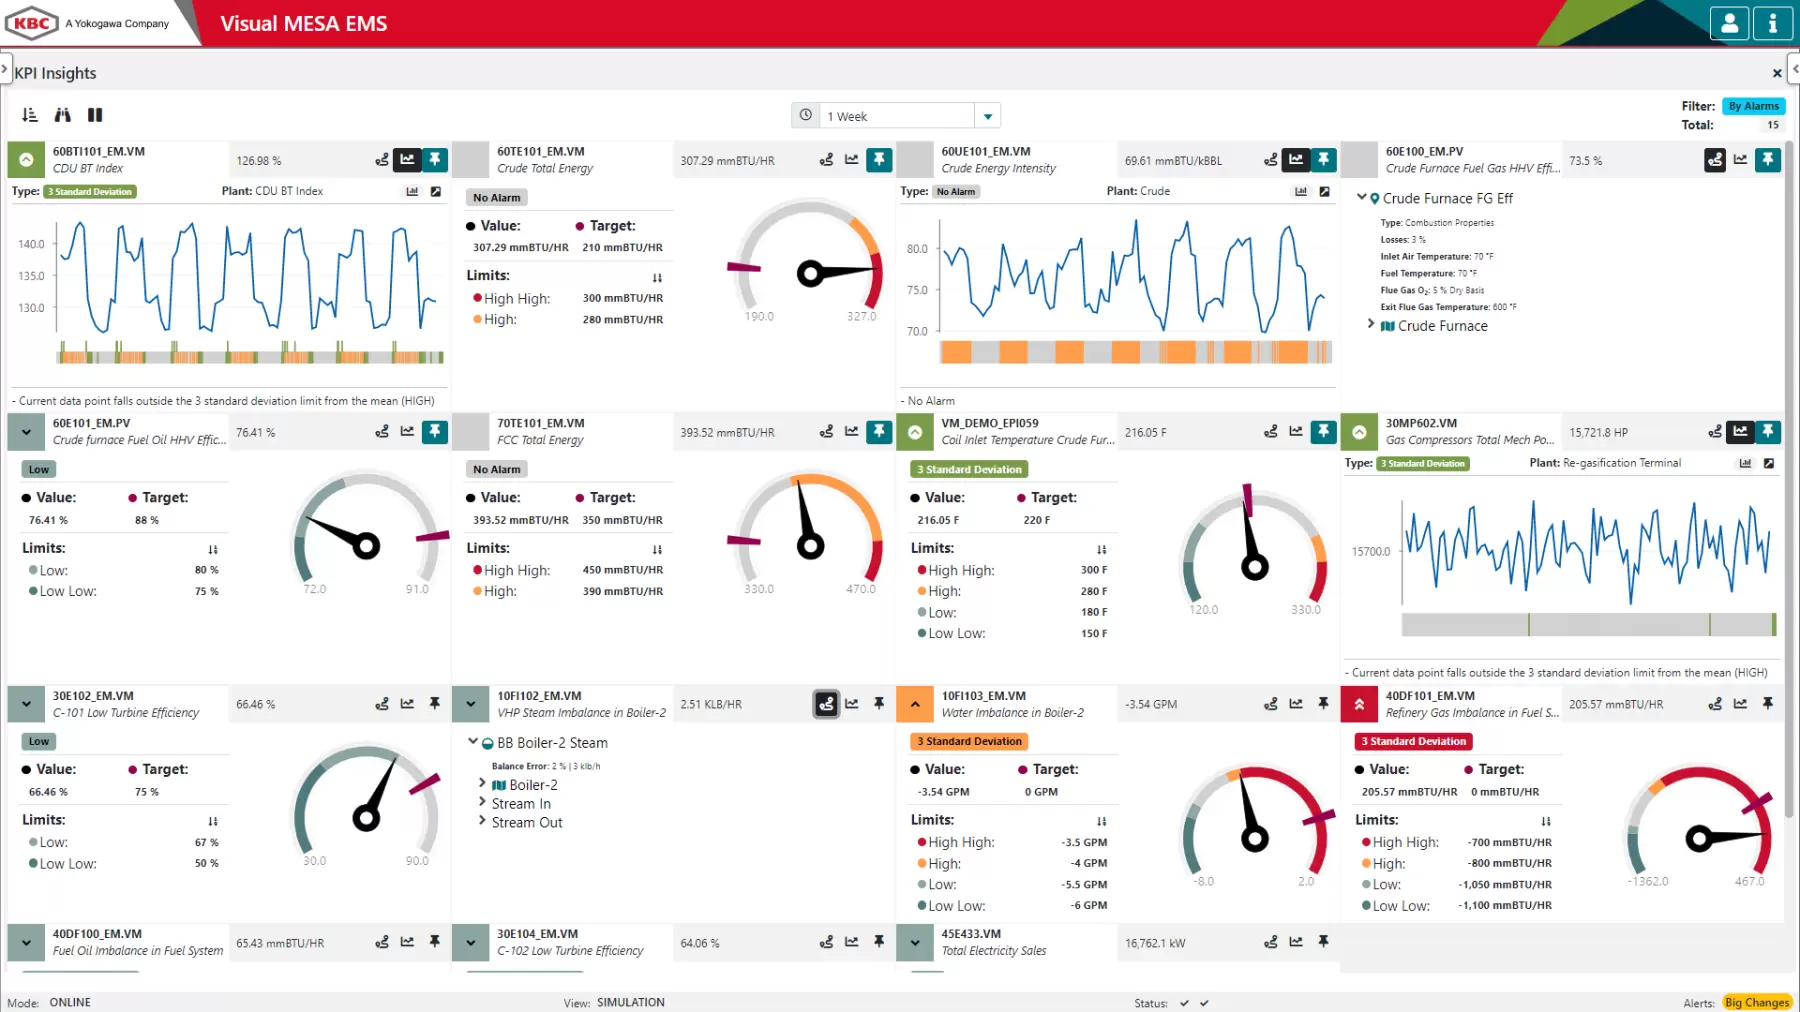
KBC brings a detailed and rigorous project methodology that allows a better understanding of the source and cause of all Scope 1 and 2 emissions from assets down to the equipment level. Mapping the process and energy demand down to the heater, boiler, and turbine level, for example, allows the emissions to be quantified, prioritized, monitored, and then eliminated using a range of solutions such as electrification, hydrogen firing, reduced flaring, reduced energy usage and through carbon capture. Dashboards synthesize and distribute the information and targets to allow drill-down analysis remotely and in real-time.

Knowledge Is Power (The Kind With Zero Emissions)

Building Your Roadmap to Zero Carbon Intensity

KBC models, measures, and reports carbon intensities of each feedstock and product using detailed carbon allocation models. KBC uses these models to show improvements and establish interim targets in energy and carbon intensity scores across the roadmap.

Optimization Using LP and AI Technologies

KBC uses state-of-the-art linear programming (LP) technology to measure and model business performance outcomes, constrained by real operating and market limitations to predict emissions reductions and the impacts on profitability, returns, and cash flow. KBC builds open and closed loop AI/ML (Artificial Intelligence/Machine Learning) systems to implement real-time emissions reduction algorithms for complex energy supply systems.

Unparalleled Global Acceptance

KBC’s suite of tools, although adapted to model and report the results of emissions reduction, has been used and applied successfully by the world’s largest energy companies for over 40 years.

Regulations and Industry Standards

KBC builds emissions measurement and monitoring models using a global array of emissions reduction measurement systems and standards. The business models use local, regional and global fuel credits and carbon costs. Our process modeling software makes detailed and accurate blending and product specification predictions to consider process change implications of real product yields.

Structured Roadmap to Net Zero Emissions

KBC balances a “get-started” approach to emissions reduction with a more-cautious, carefully-planned transition to each assets and group of assets energy transition. In this way, quick, no-controversial, and low investment momentum is built (“no-regret” decisions) while more understanding and information is modeled concerning future options that carry more cost and greater risk.

Setting a Baseline for Toolkit Calibration
Early Wins
Scope 1 and 2 Elimination
Asset Re-alignment – Scope 3 Elimination
Dashboards
Energy Transition stages 1&2 diagram

Data gathering, tool building, and early progress

The first two steps focus on gathering baseline data and using this to tune and calibrate generic process and utility maps. Using this allows confirmation of emissions sources and drivers, and the impact of the inter-connections on energy and process trade-offs as emissions are reduced and business performance optimized.

Energy Transition stage 3 diagram

Now to next major turnaround

Low and no-capital projects are identified at each asset to improve energy efficiency, process heat integration and flare reductions leading up to and beyond the first major asset capital turnaround (typically within one to three years).

Energy Transition stage 4 diagram

Last major turnaround before 2030

Initial deployment of major capital to eliminate asset-based Scope 1 and 2 emissions through hydrogenation, electrification, carbon capture, and sequestration.

Energy Transition stage 5 diagram

2030 and beyond

Reconfiguration of assets and networks of assets to use new technologies, alternative feedstocks, to produce new fuels and energy, to integrate with neighboring industries and link with collective approaches to achieving Net Zero emissions targets.

Visual MESA Energy Management System dashboard

Synthesizing and distributing emissions reduction progress

KBC works with in-house or industry standard information gathering, calculating in real-time, reporting, and presenting synthesized emissions data at all levels. Real-time, Visual MESA® Energy Management System digital twin-based models, allows for drill-down identification of emissions KPIs and targets up to an equipment level of detail.

power plant schematic

Optimizing Groups of Refineries

KBC is working with a refining hub to explore the emissions reduction potential by optimizing the system holistically, rather than individually. By sharing information appropriately, KBC is building a combined system of systems approach to allow each plant to make its individual production objectives while minimizing the collective emissions, through efficient use of energy systems, production capacities, and logistics.

Vikas Singh - Profile Picture

Vikas Singh

Process Simulation Expert

Meet our expert on energy efficiency improvement

"The Petro-SIM® process simulator allows seamless connection between energy demand and supply to be accurately modeled and the resulting emissions understood in great detail. The ability to credibly evaluate options to reduce Scope 1, 2, and 3 emissions quickly in multiple scenarios with their full economic impact is a tremendous advantage in de-risking future plans and investments in achieving Net Zero targets. This is a game-changer."

More on this expert